
Making data-driven decisions can help you take your business to the next level by giving you the knowledge you need to make better choices so you can grow your business faster, improve your ROI, and even give you a leg up on your much larger competitors.
As data-driven digital marketers, we highly recommend Google Analytics to all of our clients so they can use this treasure trove of information as a competitive advantage. Google Analytics gives you a wealth of information to work with, but even for those with years of experience, Google Analytics can still be overwhelming. That is why we created this introduction to Google Analytics to give you the right foundation and improve your business decision-making process.
In this Introduction to Google Analytics, we’ll shed light on the following topics:
- What Is Google Analytics?
- Benefits of Google Analytics
- Google Analytics Metrics
- Limitations of Google Analytics
- Google Analytics Courses & Certifications
- How To Use Google Analytics Like A Pro
What Is Google Analytics?
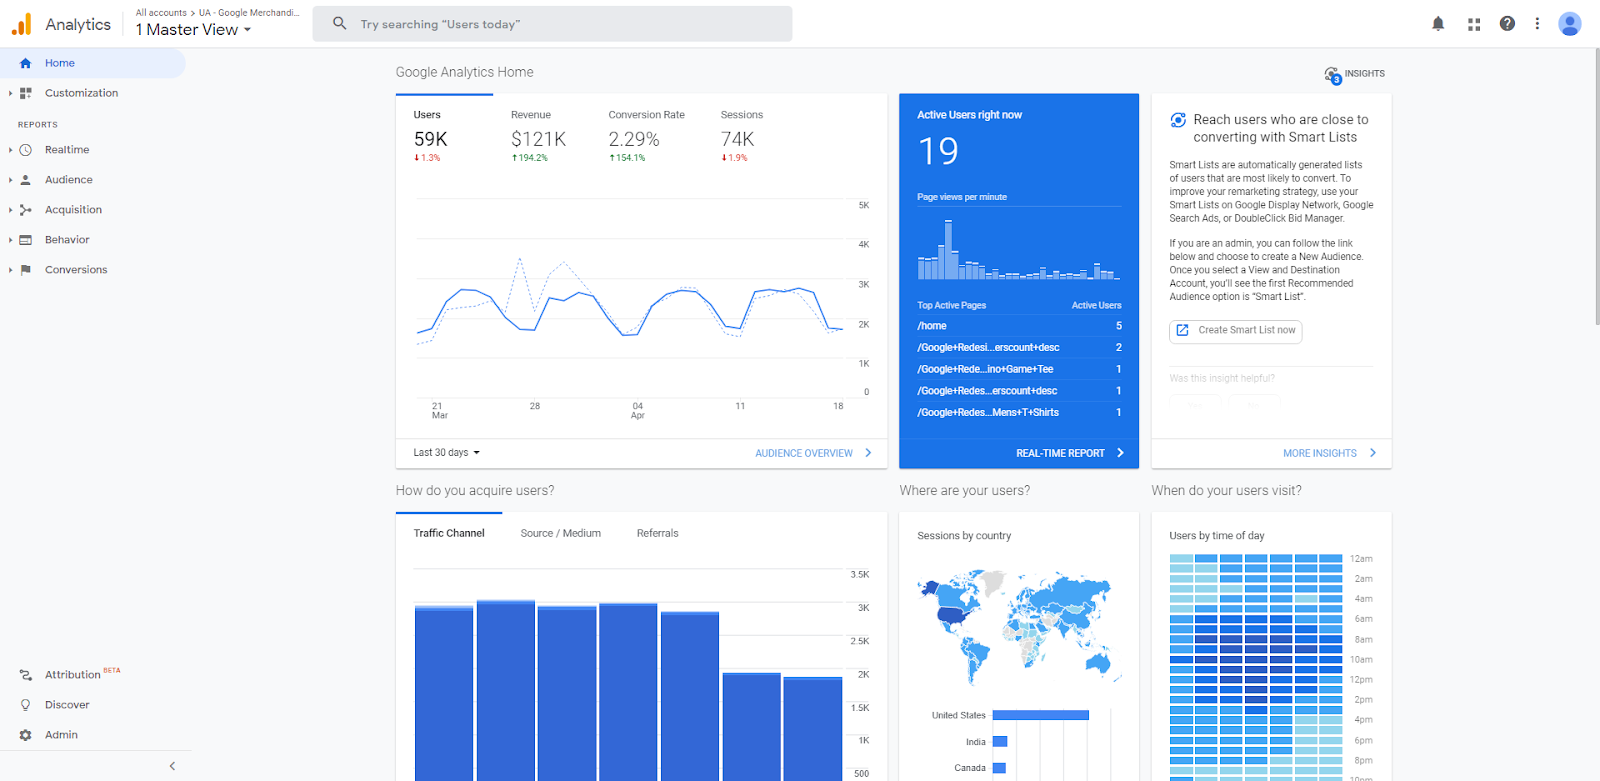
Google Analytics is a powerful website analytics service from Google that’s designed to help website owners understand how users engage with their website. Google Analytics can be installed on nearly any website, is easy to set up, and gives you data to power business insights for free.
The standard, “out of the box” implementation of Universal Analytics measures the number of website visitors, how long they stayed on your website, what pages they visited, where they came from, where they are located, trends over time and so much more without any additional configuration.
In fact, Google Analytics is usually considered the de facto website analytics solution and is an essential tool for any data-driven digital marketer because it captures so much information and has many benefits.
Benefits of Google Analytics
As you become more familiar with Google Analytics, you will learn there are many benefits beyond what we have listed below. This introduction to Google Analytics is only meant to give you our favorite benefits of Google Analytics:
Free to use: There is no cost to use Google Analytics. While there is a premium version for very advanced Google Analytics users, we’ve found the free version to be more than adequate for most Google Analytics beginners.
Easy to set up: To install Google Analytics, simply add a single piece of code to all pages of your website. This javascript code snippet is automatically generated for you after you have signed up and provides easy-to-follow instructions. Additionally, because it is a Google product, it also provides seamless integration with other Google products like Google Ads and Google Search Console.
Flexible: Google Analytics can be configured to fit your website infrastructure so you can track what is most important to your business. Google Analytics plugins1 allow you to enhance its functionality for enhanced ecommerce, remarketing, or cross-domain tracking.
Lightweight: Google Analytics was built with site speed in mind so it is very lightweight and won’t slow down your website. That said, even if it did slow down your website a little bit, we’d suggest that the information gained is worth far more than the speed sacrificed.
Mountains of data: For a free service, Google Analytics gives businesses, app developers, entrepreneurs, website owners, and marketers, more information than most know what to do with. If you’ve set up Google Analytics correctly, these mounds of data can become a huge competitive advantage for you.
Overall, we’ve found Google Analytics to be the right combination of power, flexibility, and (no) cost for our clients at Intigress. Now that you’ve been introduced to Google Analytics, let’s dive a little deeper to examine the key Google Analytics metrics you will see once you’re using it.
Google Analytics Metrics
There are tons of metrics in Google Analytics and some are more straightforward than others. To help you decipher which Google Analytics metrics will be the most helpful for your business, it is important that you understand what each of the Google Analytics metrics is actually measuring. This way you’ll be able to interpret the data correctly and use it to make better business decisions.
Google Analytics metrics can be broken down into 3 categories:
User Metrics
As the name implies, User Metrics in Google Analytics intend to deliver information about your website’s users. These dimensions include demographics (user language, location, age, gender), device information (mobile OS, browser), and behavior information (new vs returning, frequency of visits). You can find your User Metics under the Audience section on the left hand side.
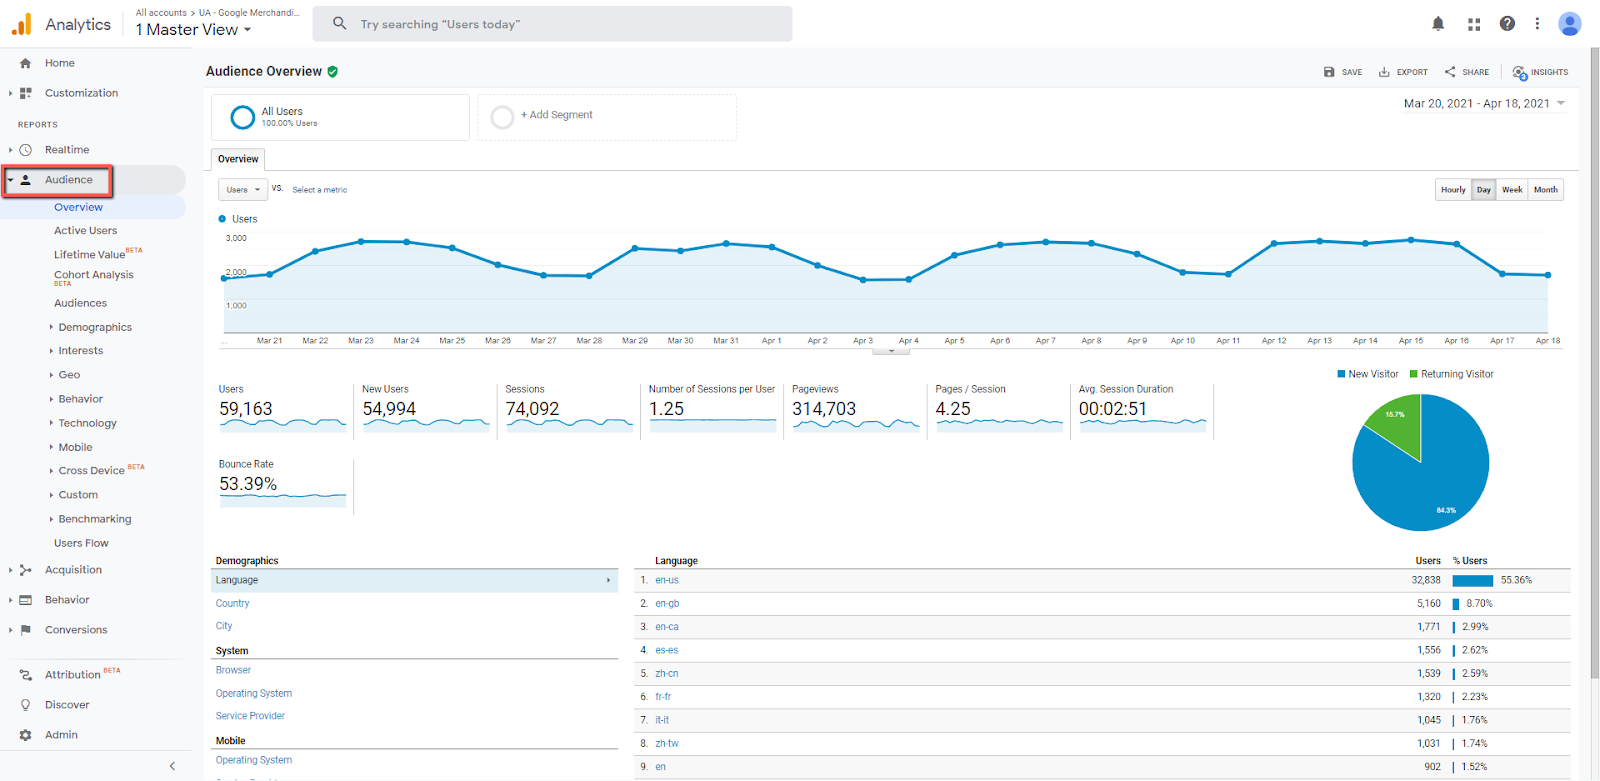
Below are the definitions of the most common User metrics in Google Analytics.
Users – In Google Analytics, a User2 is actually closer to a single device than an individual human. This can be a bit misleading since the use of the term “User” sounds as if it is measuring one individual human when in fact, one person can count as multiple Users if they access your device from multiple devices and are not signed in to Google or clear their cookies.
New Users – New Users identifies how many new client IDs were generated thereby identifying a new browser in a given time period.
Sessions – A very simplified way to think about Sessions is one visit from one unique device. If a single User visits your site multiple times or stays beyond the session duration limit, they can generate more than one session. In technical terms, a Session3 is a collection of Hits by a User within a given time period, 30 minutes by default. A Hit is when the Google Analytics tag fires a page view or sends other information to the Analytics servers for processing. You can change your Session Timeout limit by going to Admin > Tracking Info at the Property level > Session Settings.
Number of Sessions per User – The average number of times your Users have visited your site in the selected time period. If you have a lot of returning visitors, this number will be higher.
Bounce Rate – Google’s definition of Bounce Rate is “the percentage of all sessions on your site in which users viewed only a single page and triggered only a single request to the Analytics server.” Bounce rate4 is one of the most misunderstood metrics in Google Analytics so we highly recommend you fully understand it before analyzing it. Generally, the lower the Bounce Rate, the more engaged your Users are.
Pages / Session (e.g. Pages Per Visit) – Pages per session indicates the average number of pages your Users visit before leaving your site. If your Pages / Session is low, it could mean that you don’t have enough internal links or your pages aren’t engaging. If it is high, it could mean that your visitors are having difficulty finding what they came to your website for or that they are highly engaged with the content you have on your website.
Avg. Session Duration (e.g. Time On Site) – Average session duration tells you how long your average User stays on your site. Please note that this metric is only counted5 if one or more interaction hits are fired. If a User bounces, then their Session won’t have an average session duration thereby lowering your website’s average session duration. While you generally want visitors to stay on your website for longer periods of time, similar to Pages / Session, a high Session Duration could mean that visitors can’t find what they are looking for.
Page Metrics
Besides User metrics, Google Analytics also gives you Page metrics so that you can see how your pages are being interacted with. You can find your Google Analytics Page metrics under the Behavior section on the left side.
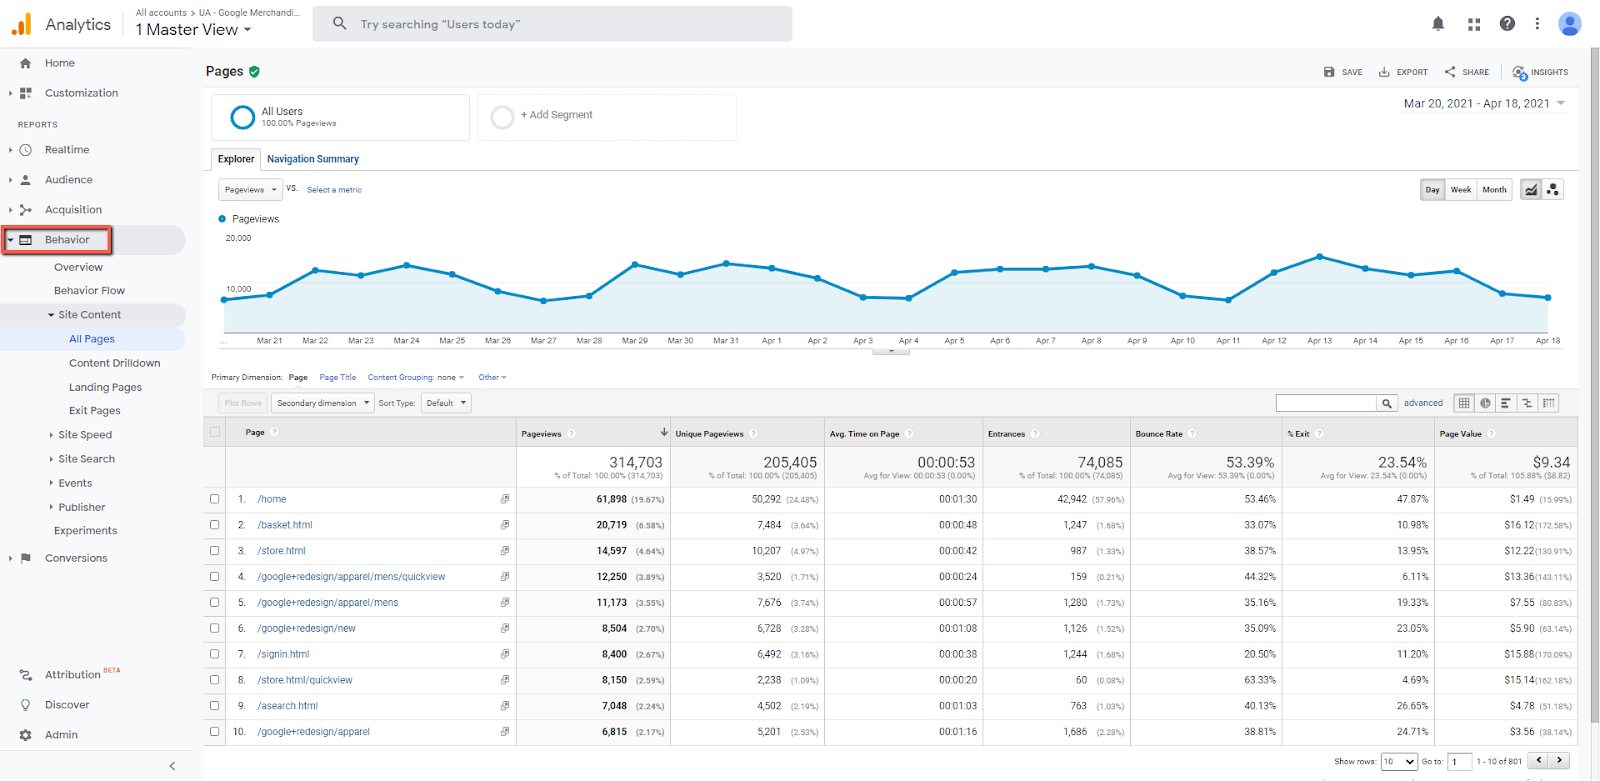
Below are the most common page metrics in Google Analytics
Pageviews – the number of times your page loaded. If a User went to the same page twice in a session, this is counted as 2 pageviews.
Unique Pageviews – The number of times an individual page is viewed at least once. Unlike the above example, if a User visited the same page twice in one session, this would be counted as only 1 Unique Pageview.
Avg. Time On Page – The average amount of time Users spend on a given page.
Entrances – The number of times a visitor came to your website and first visited the given page. The entrance page is also called the Landing Page.
Bounce Rate – The page-level bounce rate indicates the percentage of single-page sessions that had 0 interaction hits for a particular page.
% Exit – Percent Exit tells you how often a User’s session ends after visiting this page. This page then becomes the Exit page, in other words, the last page someone visits before leaving a website.
Page Value – The Page Value metric is the value of all Transactions/Goals that occurred on this page divided by Unique Pageviews. This means that pages with contact forms, checkout purchases, or other important actions will have a higher Page Value. If your Google Analytics is not set up with transactions or goal values, you won’t have any information in the Page Value data.
Conversions
User metics and Page metrics are great, but perhaps the most useful information is the Conversion metrics in Google Analytics. They take a little extra time to set up and may require some code to be placed on your site, but they are extremely helpful in measuring your website’s performance. Unsurprisingly, these can be found under the Conversion dropdown.
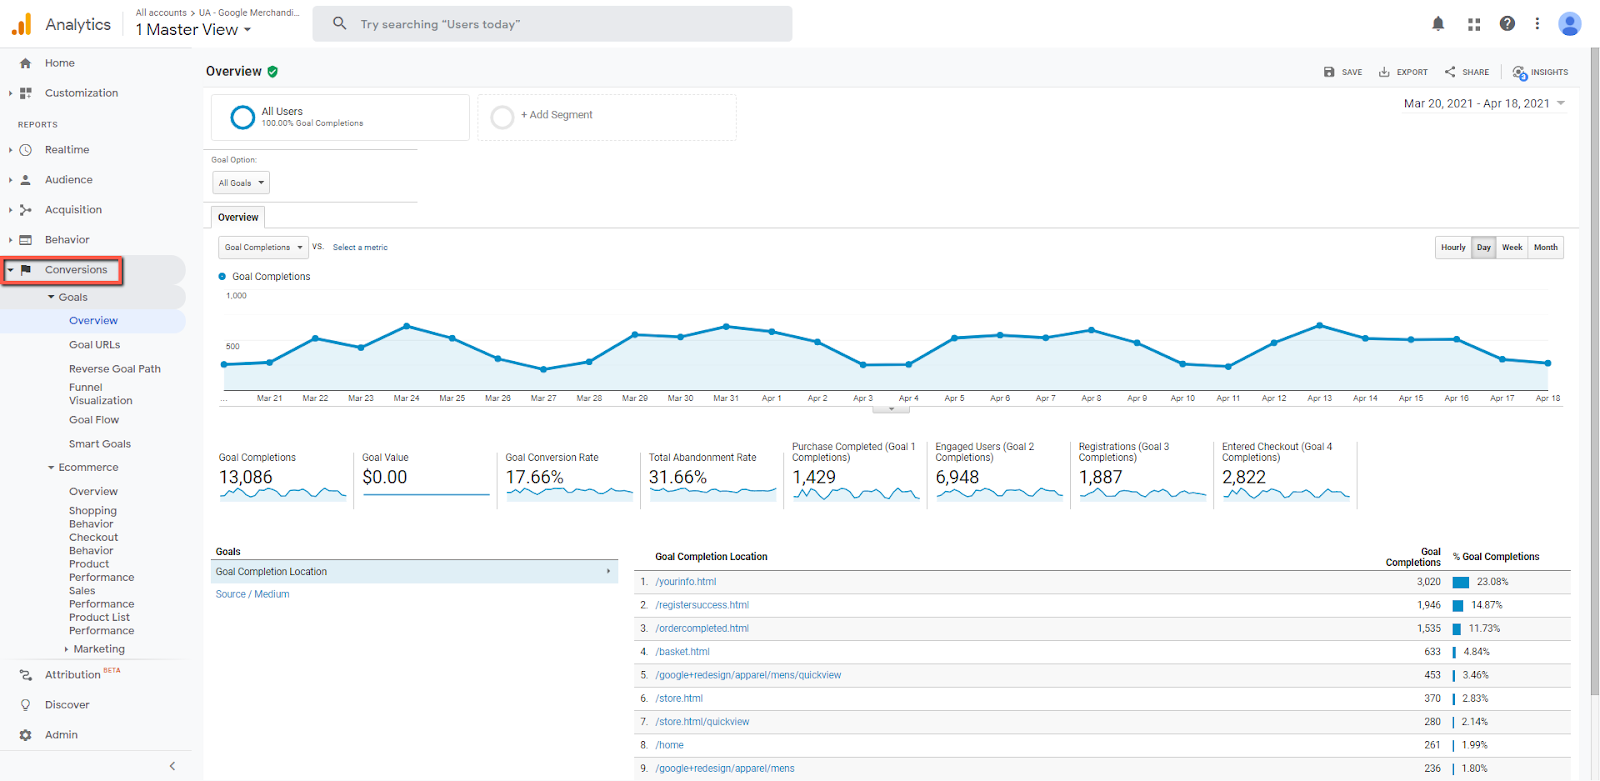
A Conversion in Google Analytics is an important action that’s taken on your website, such as an ecommerce Transaction or a Goal completion. Conversion actions are determined by individual businesses, so that each business can measure only the website actions that are most important for them.
Pro Tip: Setting Digital Marketing SMART goals can help you determine which website actions and KPIs are most important for your business so that you can set up and measure these actions in Google Analytics.
Below are the major Conversion metrics in Google Analytics.
Goals – A Google Analytics Goal is an important action that’s usually tied to some business objective, such as a lead form or new customer. The 4 types of Google Analytics Goals a business can create are:
- Destination Goal – Fires a Goal completion when a specific page or pages are visited. This is commonly used on confirmation or thank you pages.
Pro Tip: Because a person can submit a form, then leave your site before being redirected to a thank you page, we usually prefer to set up event-based Goals (see below), instead of using a destination goal for any form submissions. This is because an event can fire at the same time a form is submitted or a purchase is made, even if that visitor leaves your site before loading the thank you page.
- Session Duration Goal – A session duration goal is an engagement goal that can fire when a user spends a set amount of time on your site. This can be used to measure how engaging a blog is, or how long users spend shopping in your online store.
- Pages per Session Goal – This engagement goal fires when a user visits a set number of pages. It’s worth noting that you can’t specify which specific pages are visited using this goal type.
- Events-based Goal – An event-based goal fires when Google Analytics senses an event occurred that matches the criteria of the Event Goal. This is our most used type of Google Analytics Goal, as it is very flexible and can be used to measure specific actions that are important for your business.
- Ecommerce Transactions – A transaction in Google Analytics counts the number of purchases that are made on your site.
Revenue – The amount of money earned from all tracked transactions.
Average Order Value – Your average order value is your total revenue divided by the number of transactions.
Limitations of Google Analytics
There are many great things about Google Analytics, but there are some limitations that you need to be aware of.
Ad blockers – In this age of expanding consumer privacy regulations, many people and browsers use ad blocking technology which can prevent Google Analytics & other online tracking tools from collecting information.
Rigid reports – Although there are numerous standard reports in Google Analytics, the pre-defined reports feel a bit rigid and can cause confusion when looking for specific information. For example, you can only use 2 dimensions (a primary dimension and a secondary dimension) to slice and dice the reports.
Pro Tip: If you need to get more specific than the 2 dimensions allow, try using the Query Explorer or creating a custom report to dissect your data even further.
Can’t overwrite – After Google Analytics is installed and it starts to collect data, most of that data is locked in there and can’t be overwritten. Unfortunately, there is no way to backfill or correct previously collected data.
Pro Tip: Instead of creating a Google Analytics Filter, which permanently changes your data, we recommend using Segments in Google Analytics to slice and dice your data. Segments can even be applied to previously collected data.
Changes aren’t retroactive – Similar to the last point, any changes that you make to your Google Analytics settings, filters, Goals, etc only apply to new data moving forward and they won’t affect any previously collected data.
Sampled Data – In order to speed up some data pulls from its servers, Google Analytics occasionally6 samples your data. This is especially true when looking at large data sets or long periods of time. A data sample is a segment of data that represents a larger set.
Pro Tip: Use the sampling shield to monitor if your data is sampled. To find it, look in the top left next to the report name. If the shield is green, then your reports are not being sampled, but if the shield is orange, then data sampling is occurring. Mousing over the shield will allow you to see how much data sampling is taking place and may let you switch between “Faster response” and “Greater precision.”

Complex website setups – Google Analytics, specifically Universal Analytics, was originally developed to track single domain websites, that is one domain per Google Analytics Property. Therefore, businesses with complex setups, such as multiple domains or mobile apps, may need some additional development work in order to track their users appropriately.
“User” is misleading – Speaking of Users, as mentioned previously, the use of the word “User” in Google Analytics can be a bit misleading because it’s easy to assume that 1 User equals 1 human when in fact it is closer to 1 device. For example, if Valerie has a mobile phone, laptop at home, and a tablet and desktop at home, she could be counted as up to 4 Users in Google Analytics, and how she is counted is dependent on how she signs into or doesn’t sign into her Google accounts on each of those devices.
No heatmaps or rank tracking – Two common types of web analytics reports that are not supported by Google Analytics are heatmaps and search engine rank tracking.
While none of these limitations of Google Analytics are absolute deal breakers in our book, they are important to consider when analyzing the data to keep things in perspective.
How To Use Google Analytics Like A Pro
Google Analytics is very helpful out of the box, but there are certain tips and tricks that can help you get the most out of your Google Analytics setup.
Link Google Ads – One of the very first things we do for our clients is link Google Ads7 to their Google Analytics Property. This allows them to share data, Goals, and audiences between the two programs, which enables better reporting, targeting, and greater insight for businesses using Google Ads
Pro Tip: Don’t forget to Import site metrics8 to be able to see metrics such as bounce rate, avg. session duration, and pages / session directly in Google Ads.
Link Google Search Console – Once you’ve set up and verified Google Search Console, you can enhance Google Analytics by linking it to Google Search Console9 to pull in additional metrics like search queries, impressions, and average position for organic searches.
Create audiences in Google Analytics – An audience is a group of users that meet a set of defined criteria. You can create these lists of users in Google Analytics to analyze their performance or share that list with Google Ads for remarketing purposes. For example, if you want to understand how your most valuable customers interact with your website you might create an audience of users who have made more than 3 purchases in the last 60 days.
Use UTM parameters correctly – Perhaps one of the most underutilized features of Google Analytics is UTM parameters. UTM parameters10 are a type of URL parameters that are automatically recognized by Google Analytics and can be added to any URL to pass additional information to Google Analytics. For example, we always use UTM parameters to share Facebook Ads performance with Google Analytics.
Pro Tip: Use the Google Analytics Campaign URL Builder to ensure your UTM parameters pass data to Google Analytics correctly.
Use consistent naming conversions – In order to make analyzing data easier, we highly recommend coming up with a consistent nomenclature for your digital marketing campaigns and UTM parameters.
Use Google Tag Assistant extension – The Google Tag Assistant is a free chrome extension that can be used to check which (if any) Google tracking codes are installed on a website. It also helps to diagnose any tagging issues or non-standard implementations.
As you become more familiar with Google Analytics, these tips will help you use Google Analytics like a pro so you can get the most out of your data & analytics.
Google Analytics Courses and Certification
If you do find yourself overwhelmed by the mountains of data that Google Analytics provides, there are free courses you can take to set yourself up for success. We have taken these ourselves and highly recommend them for anyone just starting out and looking to expand on this introduction to Google Analytics. Google also offers hours of additional training on their Google Analytics YouTube channel. You can even get certified in Google Analytics.
Google Analytics Courses
- Google Analytics for Beginners – Free
- Advanced Google Analytics – Free
Google Analytics Certification
- Google Analytics Individual Qualification (GAIQ) – Free
If you don’t have the time to spend learning Google Analytics set up or reporting features, but you want all the benefits, we can help with full Google Analytics set up and ongoing website analysis and reporting to help you unlock the full potential of your website and grow your business faster. All you have to do is send us a message to get started.
Conclusion
Google Analytics is an extremely powerful website tracking tool that any business can use. While it may take time to become a Google Analytics expert, this introduction to Google Analytics gave you the right information to continue learning and take your business to the next level.
If you’re ready to grow with the power of data and web analytics, or have questions about Google Analytics (big or small), feel free to reach out to our team of Google Analytics gurus.
Resources
- Using Plugins | Analytics for Web (analytics.js) – Google Analytics Developers Guide
- How users are identified for user metrics – Google Analytics Help Article
- Session and campaign timeout handling– Google Analytics Help Article
- Bounce rate– Google Analytics Help Article
- Session Duration, Avg– Google Analytics Help Article
- About data sampling– Google Analytics Help Article
- Linking analytics and ads – Google PDF
- Make sure you are importing Site metric– Google Analytics Help Article
- Configuring Search Console data in Analytics– Google Analytics Help Article
- Collect campaign data with custom URLs– Google Analytics Help Article
4 Responses
Thanks for sharing such an amazing post. Keep it up.
Your welcome. Glad you like it.
Great content to understand Google Analytics for beginners.
Awesome! The goal of this article was to give beginners a solid starting point. We’re happy you agree.