
Many marketers have grown accustomed to using Universal Analytics since it has been the go-to website analytics tool for over a decade. However, since Universal Analytics will stop processing new data in 2023, many marketers and business owners are making the switch to Google Analytics 4 now. However, GA4 is quite a bit different than Universal Analytics and there is definitely a learning curve. In order to help you get used to Google Analytics 4, we thought it’d be helpful to recreate Universal Analytics reports in GA4 or otherwise show you where to find the same information in the updated UI.
Before We Begin:
- If you haven’t already, we highly recommend creating your GA4 property now before Universal Analytics stops processing data at the end of Q2 in 2023.
- Check out our Intro to GA4 article if you’re new to Google Analytics or need a refresher on what makes GA4 better (There, we said it!).
- Universal Analytics had over 100 “standard reports” so we will just look at the most commonly used ones. There was a lot of overlap between the UA reports and many were rarely used by most people.
- Screenshots are taken from Google’s Demo accounts which anyone can access.
- Google Analytics 4 is a paradigm shift in order to accommodate privacy regulations and mobile devices so some things are intentionally different.
- Google Analytics 4 is still a work in progress and bugs are still being fixed.
Article Organization
This article is structured similarly to how Universal Analytics organized its standard reports. For example, we have an Audience section, an Acquisition section, a Behavior section, and a Conversions section. Feel free to use the table of contents to jump to what’s most important to you.

Within each section you’ll find:
- The name of the Universal Analytics report
- Where the Universal Analytics report was located
- A screenshot of the Universal Analytics report
- How to get to or recreate the Google Analytics 4 version of the same report
- Similar UA reports that can be viewed or recreated in a similar way
Now with that out of the way, let’s get into it.
Audience Reports In GA4
Demographics: Age Report
Universal Analytics Location: Audiences > Demographics > Age

Google Analytics 4 Location: Reports > User > Demographics > Demographics details
- Select “Age” from the dropdown (Must have Google Signals enabled in order for this report to populate with data)
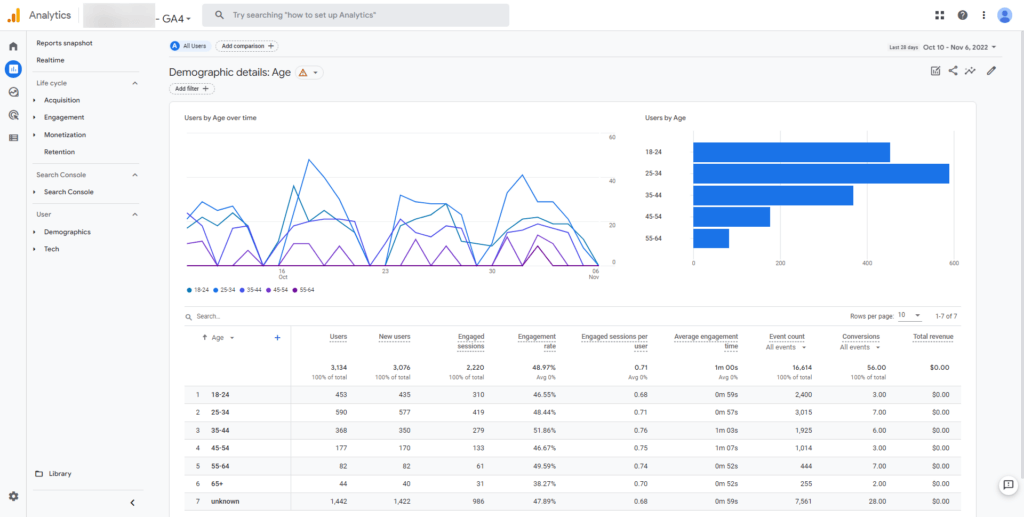
Compared to Universal Analytics, the other benefit of the Demographics details report in Google Analytics 4 is that you can load the following reports without having to reload the whole page which makes it faster to access this data.
- Country (United States, United Kingdom, Canada, etc)
- Region (California, England, Ontario, etc)
- City (New York, London, Toronto, etc)
- Language (English, Spanish, French, etc)
- Age (18-24, 35-44, 65+, etc) – This report
- Gender (Male, Female, Unknown)
- Interests (Shoppers/Value Shoppers, Travel/ Business Travelers, Technology/Technophiles, etc)
Location Report
Universal Analytics Location: Audience > Geo > Location
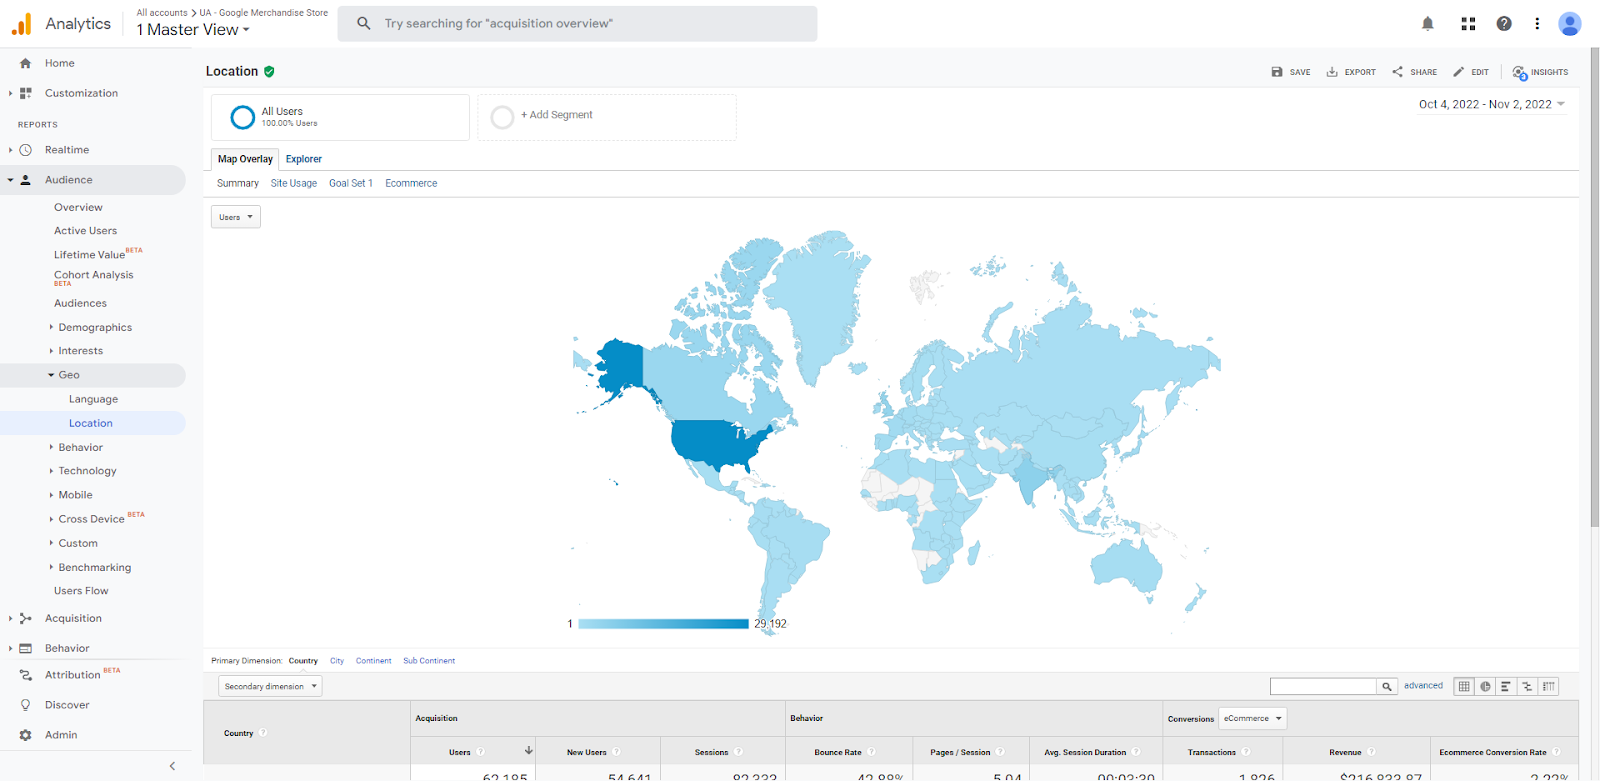
Google Analytics 4 Location: Reports > User > Demographics > Demographic details
- Select “Country” (default) from the dropdown
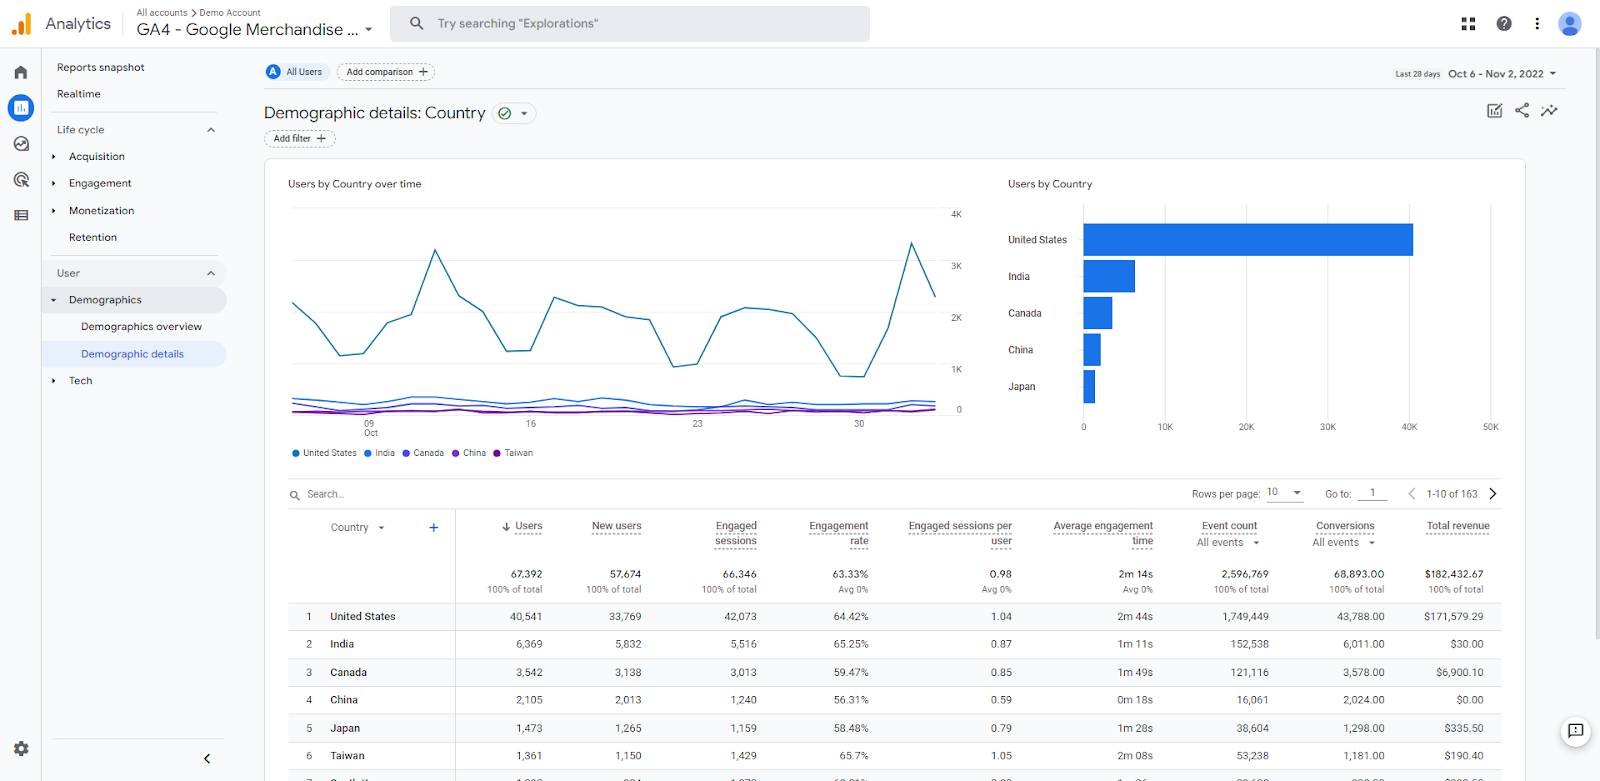
To recreate the country heatmap, you’ll have to use GA4 Explorations
- Explore > Blank
- In the Variables section (first column), click the plus sign (+) next to Dimensions then select “Country” under the Geography dropdown. Click the blue Import button.
- In the Variables section, click the plus sign (+) next to Metrics then select “Total users” under the User dropdown. Click the blue import button.
- In the Tab settings (second column), choose the “Geo map” under Visualization.
- Add Total Users metric as the values.
- If you’d like to show more than the top 10 countries with users, you’ll have to increase the “Points per dimension” dropdown from 10 (default) to a higher number (max 50)

Pro Tip: This map is a little different than the version in Universal Analytics because it uses bubbles instead of shading in the full countries. If you’d like to fill in the countries instead, you can use Looker Studio (formerly Google Data Studio) to create a closer replica of Universal Analytics’ Geo Map.
Pro Tip #2: Please note that Explore reports are subject to your data retention settings which ranges from the default of 2 months to a maximum of 14 months (for non-Google Analytics 360 users). Explore reports are also subject to your selected attribution settings in Admin > Property level settings [2nd column] > Attribution Settings.
Device Category Report
Universal Analytics Location: Audience > Mobile > Overview
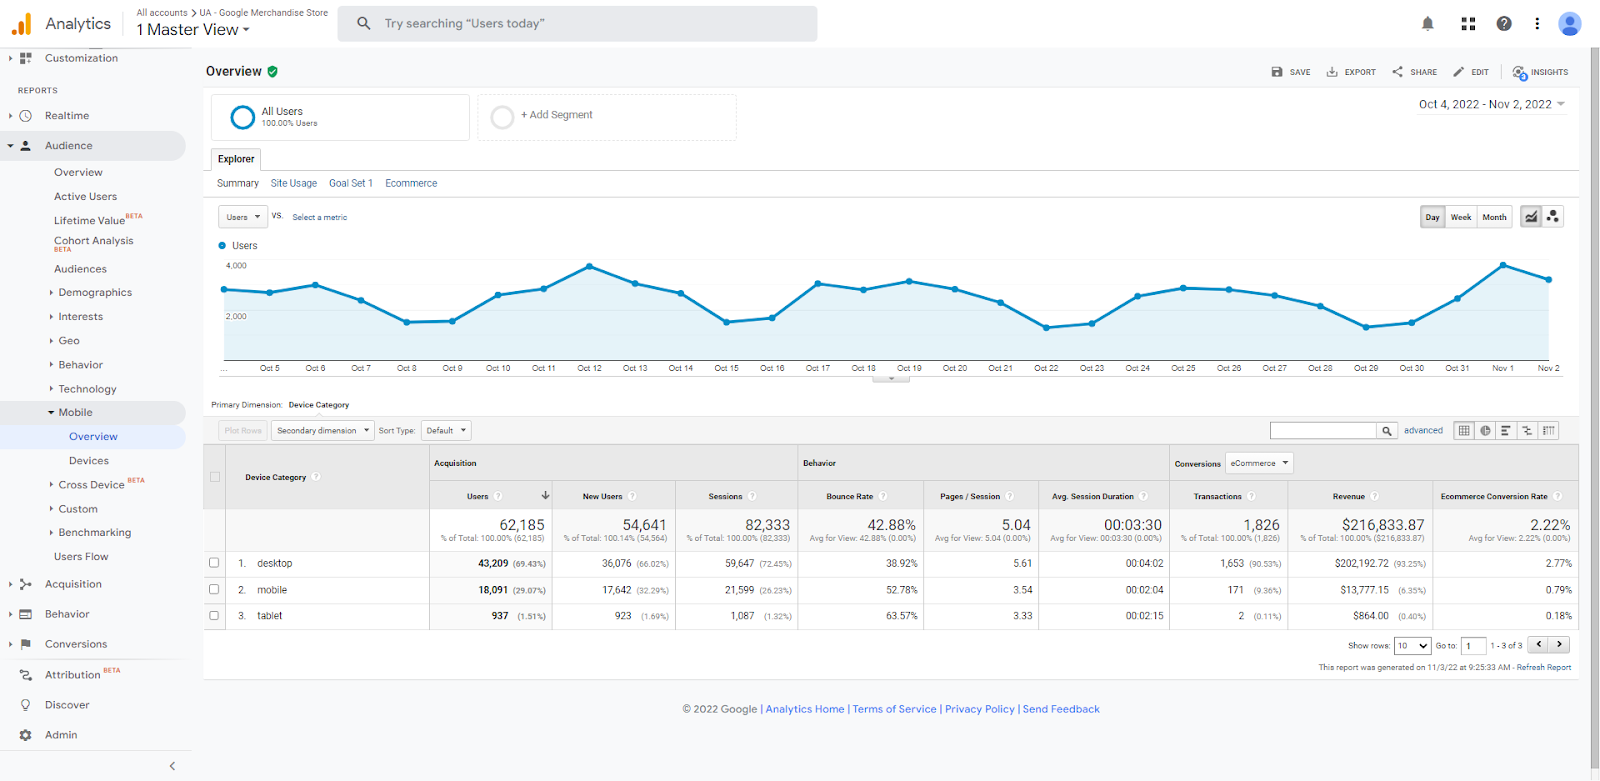
Google Analytics 4 Location: Reports > User > Tech > Tech details
- Select “Device category” from the dropdown
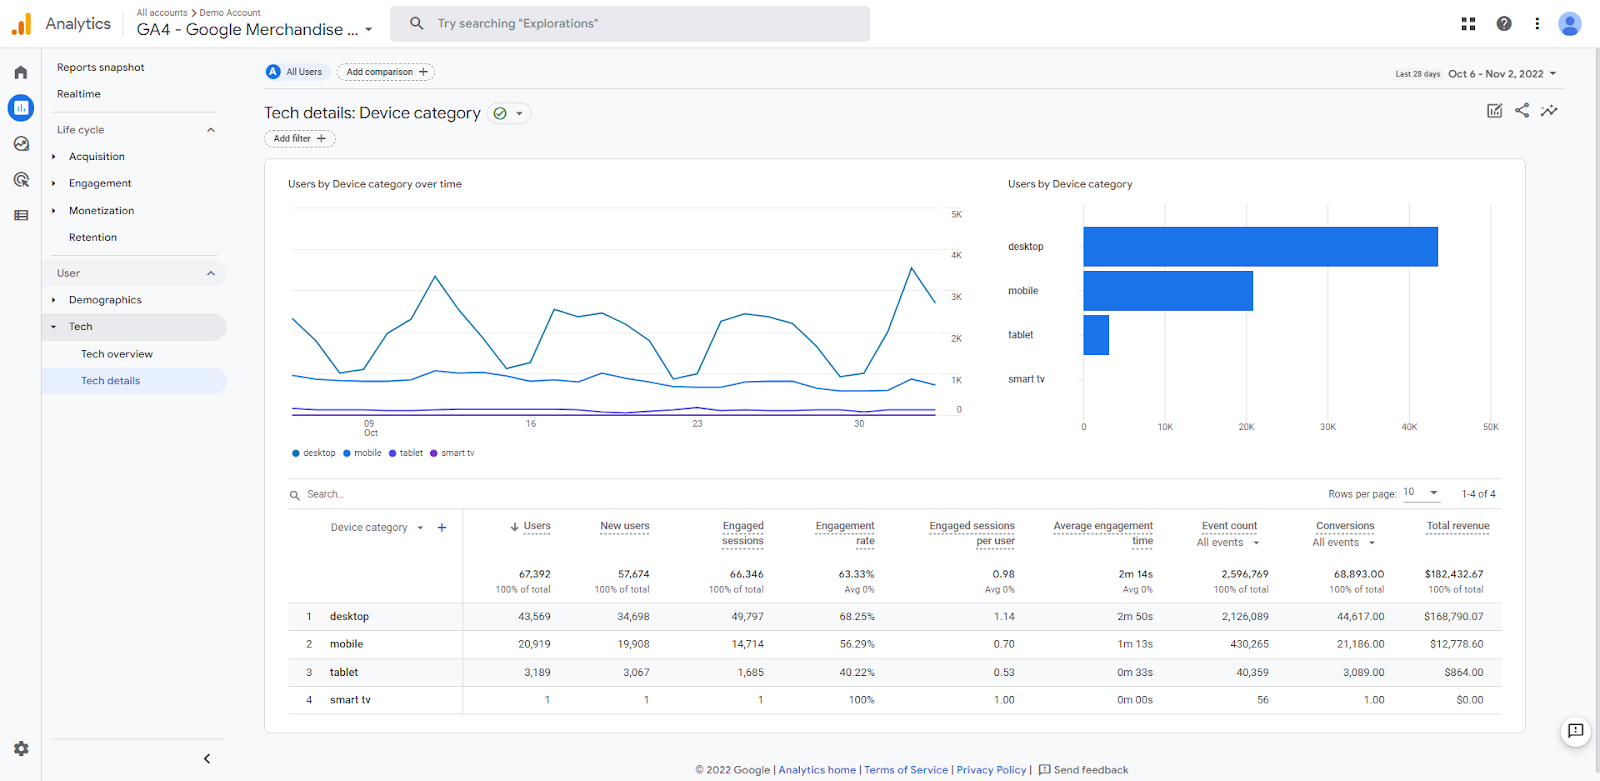
The Tech details report in GA4 can also be used to display information about the following:
- Browser (Chrome, Safari, Firefox, etc)
- Device category (desktop, mobile, tablet, smart tv) – This report
- Device model (Chrome, iPhone, Chromebook, etc)
- Screen resolution (1920×1080, 1440×900, 1280×720, etc)
- App version (2.65, 2.6.58, 2.64, etc) – App data streams only
- Platform (Android, iOS, web)
- OS version (8.1.0, 15.6.1, 10, etc)
- Platform / device category (Android / mobile, iOS / tablet, web / desktop, etc)
- Operating system (Windows, Macintosh, iOS, etc)
- OS with version (Android 8.1.0, iOS 15.6.1, Windows 10, etc)
Acquisition Reports Reports in GA4
Channels Report
Universal Analytics Location: Acquisition > All Traffic > Channels

Google Analytics 4 Location: Reports > Life cycle > Acquisition > Traffic acquisition
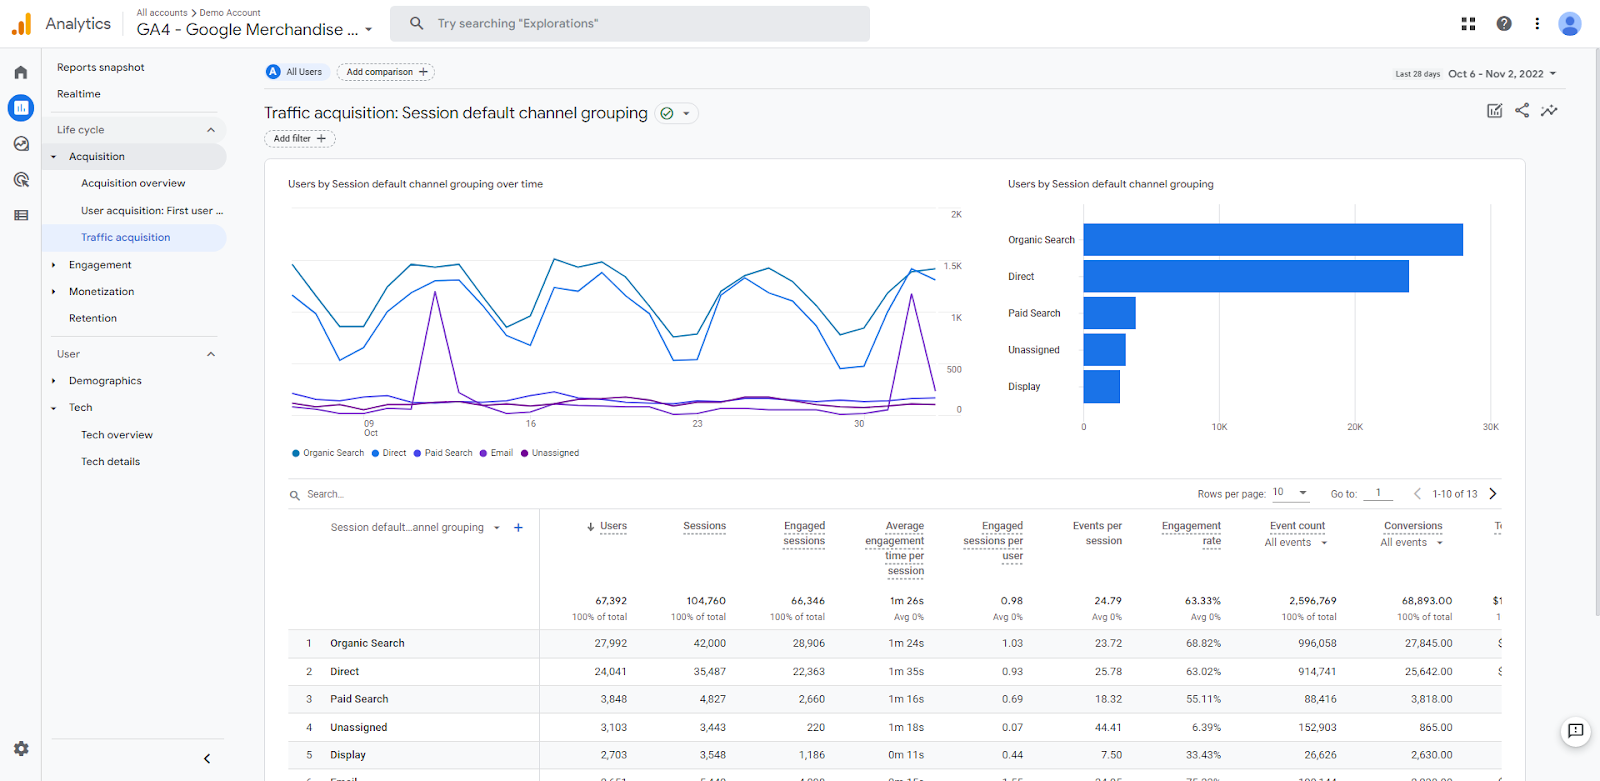
Pro Tip: Unlike Universal Analytics which tried to apply the same attribution model to nearly every report. There are actually several different attribution models that are used throughout GA4 depending on what report you’re looking at. For example, the Traffic acquisition report in GA4 uses a similar last, non-direct touch attribution to what Universal Analytics, but the User acquisition report in GA4 uses a first-touch attribution model so you can see where that user originally came to the very first time they visited the site. Keep attribution in mind when looking at each report!
In Google Analytics 4, the Traffic acquisition report in GA4 can show the following:
- Session default channel grouping (Direct, Paid Search, Organic Social, etc) – This report
- Session source / medium (direct/none, google/cpc, l.facebook.com/referral, etc)
- Session medium (none, cpc, referral, etc)
- Session source (direct, google, l.facebook.com, etc)
- Session source platform (Manual, Google Ads, Shopping Free Listings, etc) – see Pro Tip below
- Session campaign (Oct2022_FL_V1, Nov2022_Holiday_V1,organic, etc)
Pro Tip: Google Analytics 4 introduced a few new UTM parameters that were not available in Universal Analytics, specifically utm_source_platform, utm_creative format, and utm_marketing_tactic. You can use these UTM parameters, along with 5 original ones (utm_source, utm_medium, utm_campaign, utm_term, utm_content) to populate the above reports by manually tag destination URLs from sources that do not directly integrate with Google Analytics 4 (i.e. Facebook ads).
Google Ads Campaigns Report
Universal Analytics Location: Acquisition > Google Ads > Campaigns
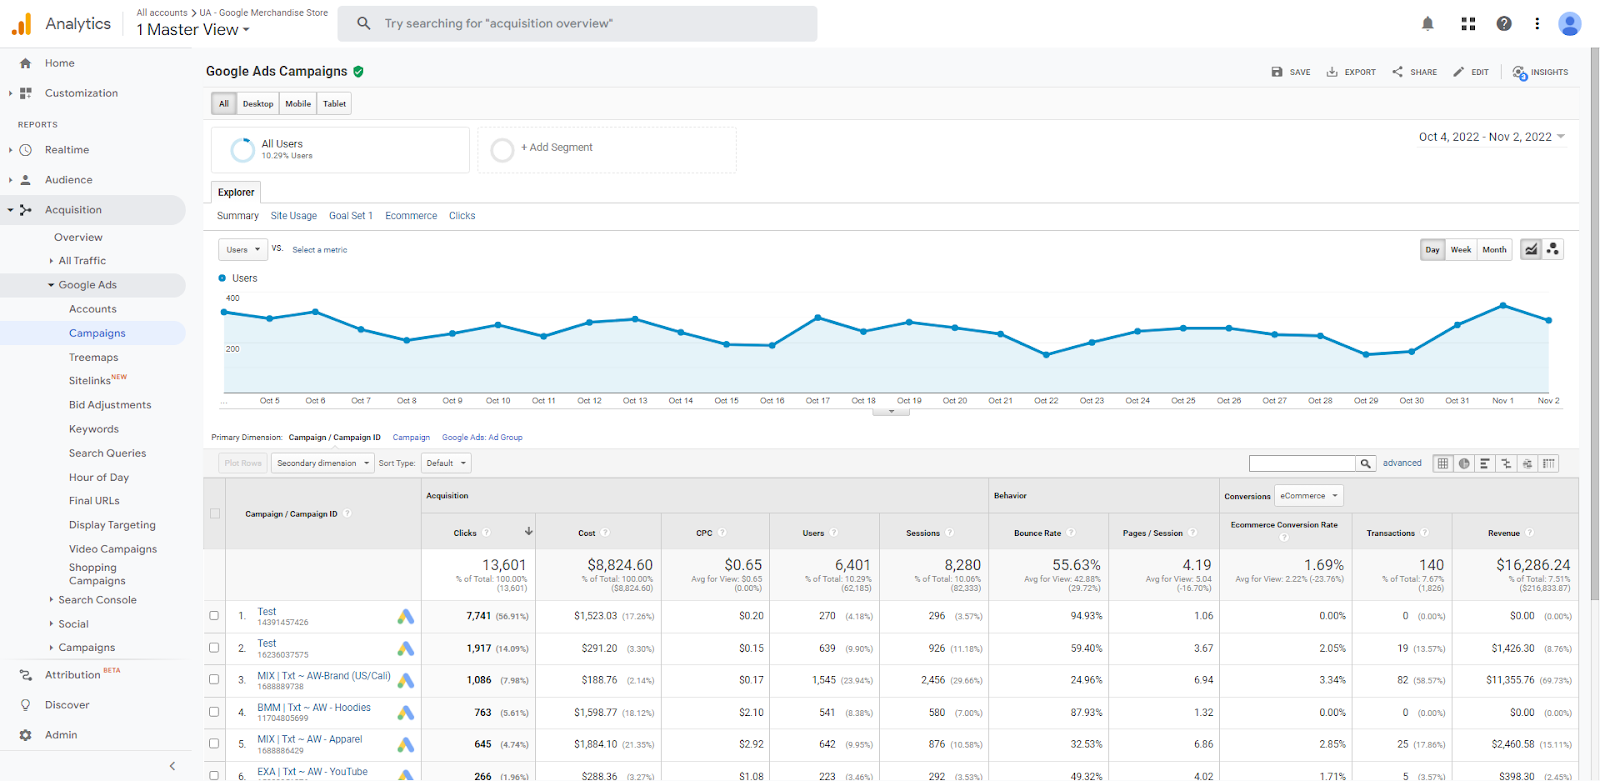
Google Analytics 4 Location: Advertising > Performance > All Channels
- Select “Source platform” from the dropdown
- Type “Google Ads” into the search bar right above it then press Enter
- Add a secondary dimension of “Session campaign”
Pro Tip: To maximize the power of this report, we recommend importing cost data into GA4. While doing is a little complex, you’ll be able to more easily understand your ROI from each channel/platform/source/etc. There are also other types of data you can import such as offline events, user data, and product data.
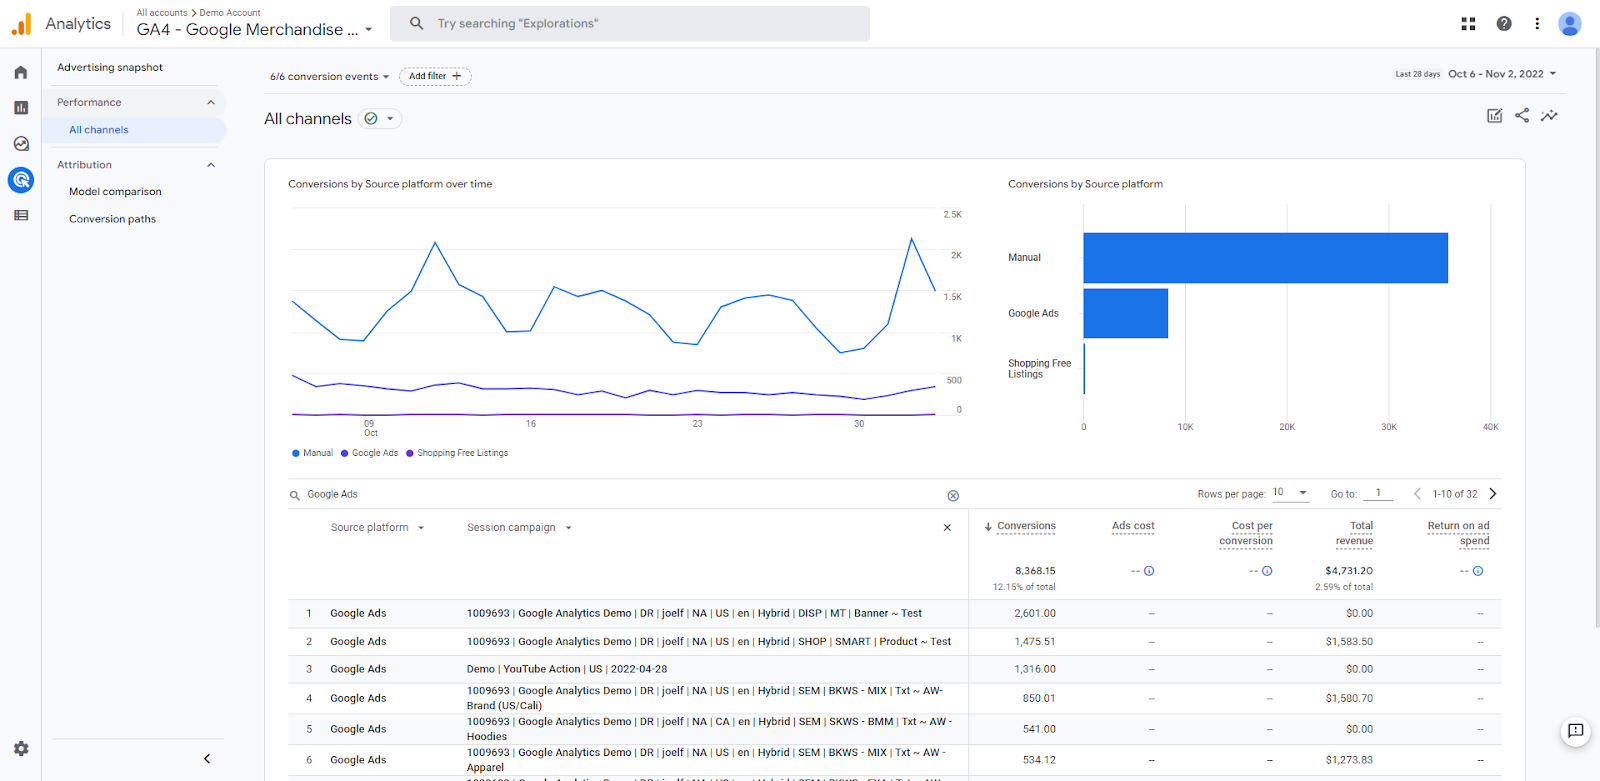
Like many of the other reports in Google Analytics 4, the All Channels report in the Advertising section fo GA4 can display data for the following dimensions:
- Default channel grouping (Organic search, Email, Display, etc)
- Source platform (Manual, Google Ads, Shopping Free Listings, etc) – This report
- Source (google, baidu, youtube.com, etc)
- Medium (organic, cpc, email, etc)
- Campaign (Shopping Free Listings, Oct2022_FL_V2, Nov2022_Holiday_V2, etc)
Organic Landing Pages Report
Universal Analytics Location: Acquisition > Search Console > Landing Pages

Google Analytics 4 Location: Search Console > Search Console > Google organic search traffic
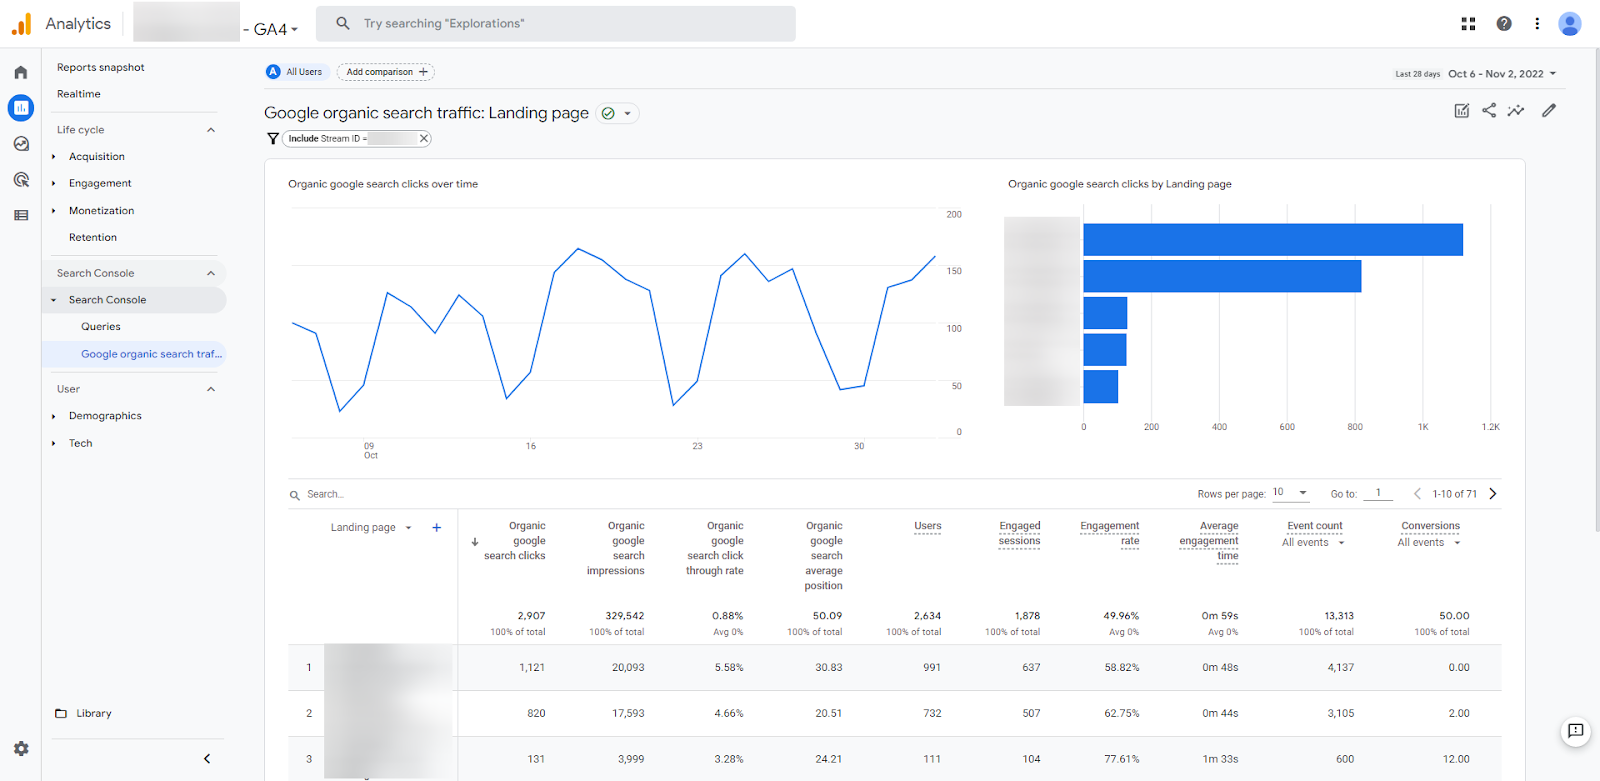
Pro Tip: You must have GA4 linked to Google Search Console in order to be able to see this report. After linking them, you can publish these reports by going to the report Library (lower left corner) then finding the Search Console collection, clicking the three dots menu then clicking Publish. (Not sure why you have to manually publish this collection, but you do for now.)
The Google organic search traffic report in GA4 can also show volume and engagement metrics by the following:
- Landing page (/, /contact-us, /shop, etc)
- Country (United States, United Kingdom, Canada)
- Device category (desktop, mobile, tablet)
Just like with Universal Analytics, this big advantage of this report (compared to just looking at Google Search Console), is that not only does it show volume metrics, it also shows engagement metrics so you can better understand the quality of the traffic being sent to your website from Google. It’s worth noting that the engagement metrics used in GA4 (Engaged sessions, engagement rate, average engagement time) differ from what is used in Universal analytics (bounce rate, pages/session), though we think they are much improved.
Behavior Reports In GA4
All Pages Report
Universal Analytics Location: Behavior > Site Content > All Pages

Google Analytics 4 Location: Reports > Life cycle > Engagement > Pages and screens
- Select “Page path and screen class” from the dropdown
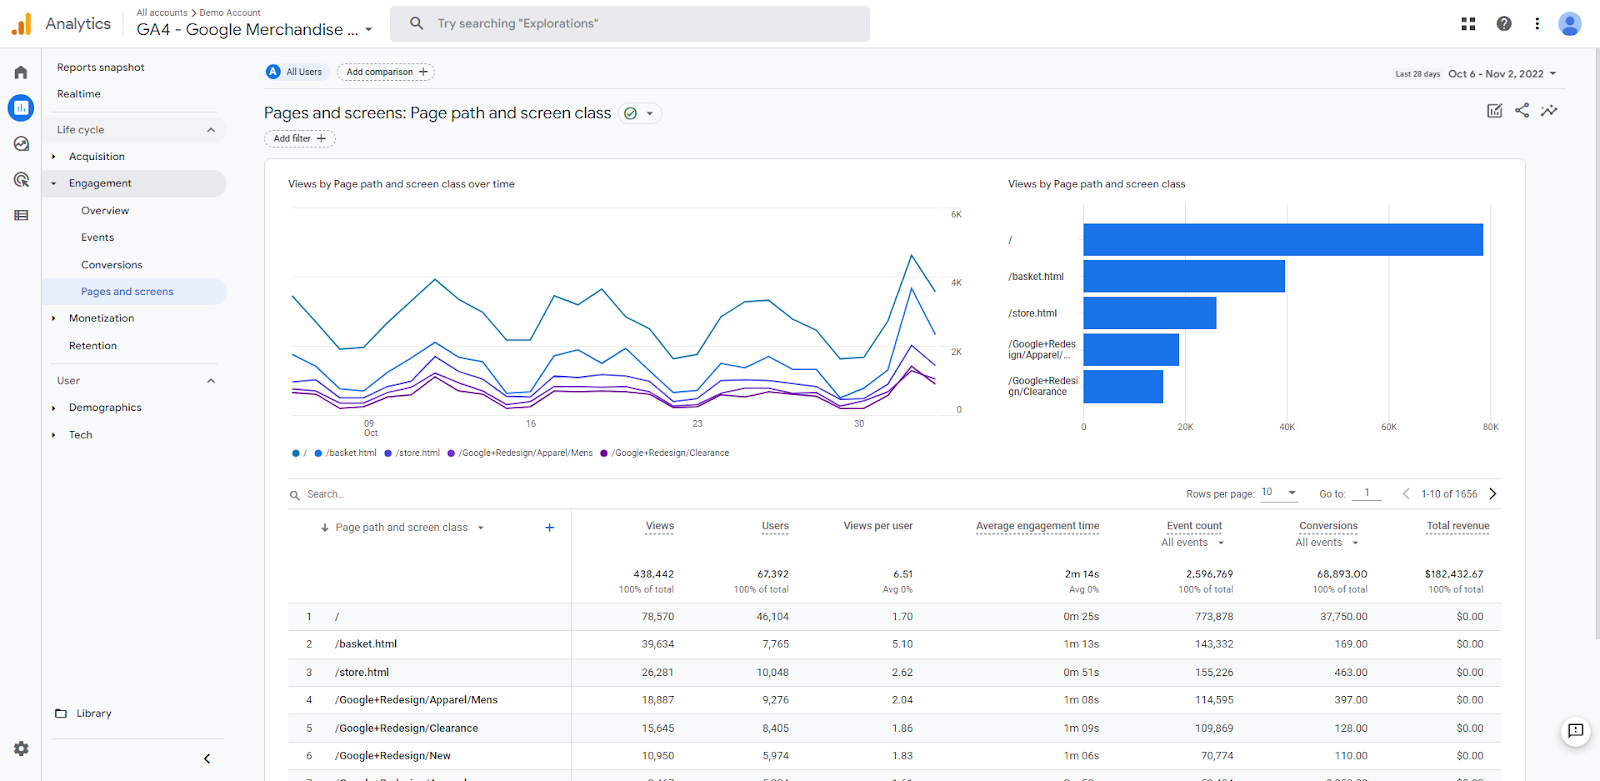
The Pages and screens report in GA4 also lets you analyze data by the following:
- Page title and screen class (Home, Shopping Cart, Men’s Unisex | Apparel | Google Merchandise Store, etc)
- Page path and screen class (/, /basket.html, /Google+Redesign/Apparel/Mens, etc) – This report
- Page title and screen name (Home, Shopping Cart, Men’s Unisex | Apparel | Google Merchandise Store, etc)
- Content group (Men’s Clothing, Women’s Clothing, Women’s Accessories, etc)
Pro Tip: Additional setup is required for content grouping to work. For every page_view event that fires, you must pass a content_group event parameter with a value to be able to see data organized by content group in GA4. You can also set up more than one content group by adding additional event parameters such as content_group2 and content_group3 then registering them as custom dimensions.
Top Events Report
Universal Analytics Location: Behavior > Events > Top Events

Google Analytics 4 Location: Reports > Life cycle > Engagement > Events
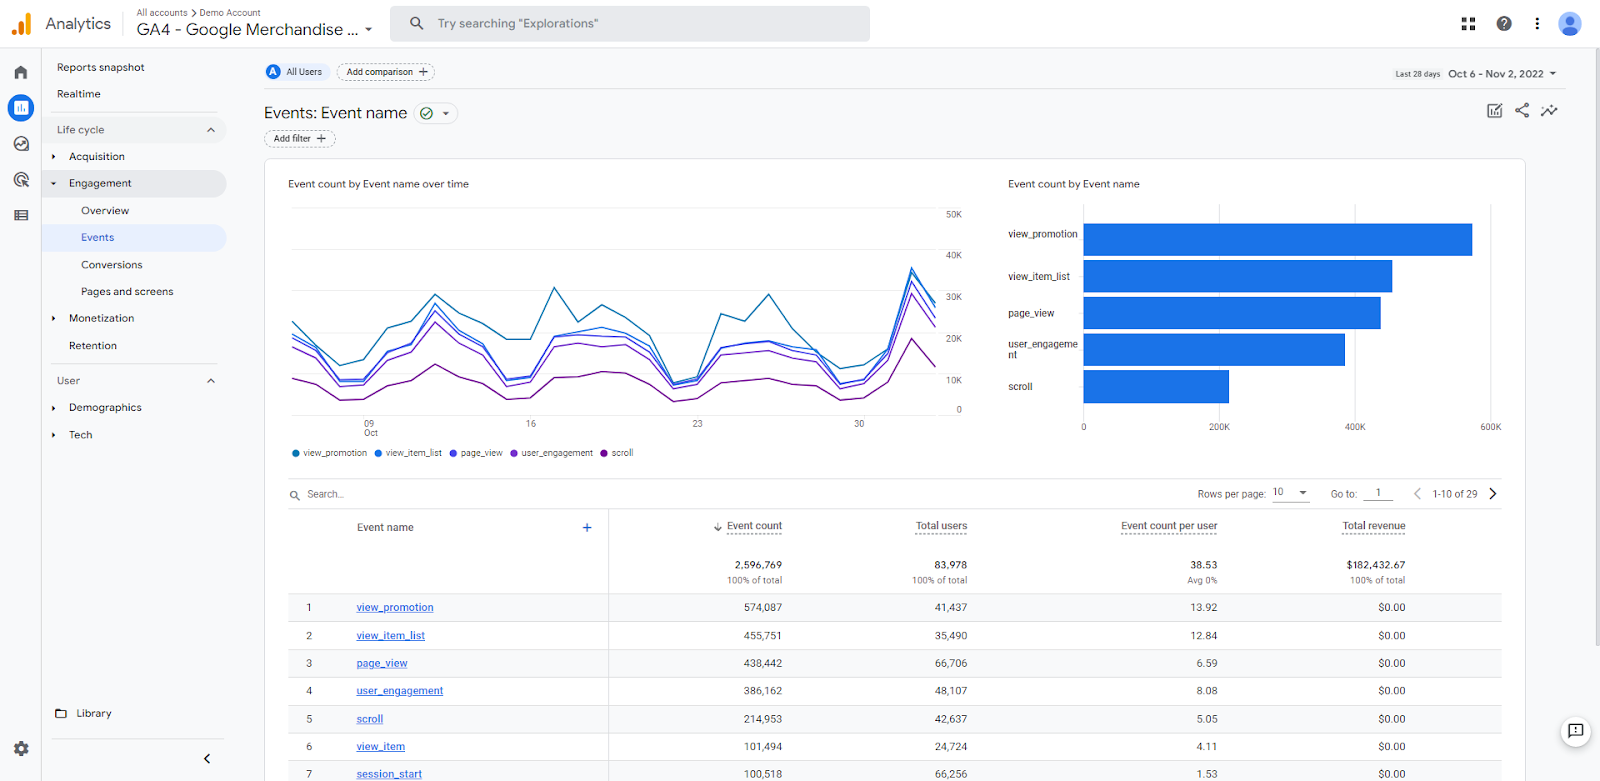
Unlike in Universal Analytics, EVERYTHING is an event in Google Analytics 4. For each event, you can see more information, such as your custom dimensions, by clicking on one of the events on this screen. For example, clicking on the purchase event brings up a new screen with data specific to that event.

Conversions Reports in GA4
Shopping Behavior Report (and Checkout Behavior)
Universal Analytics Location: Conversions > Ecommerce > Shopping Behavior

Google Analytics 4 Location: Explore > Blank
- In the Variables column, click the plus sign (+) next to Dimensions, select “Event name”, then click the blue Import button.
- In the Tab Settings column, choose the “Funnel exploration” technique
- Turn on “Make Open Funnel” so that users may enter your funnel at any point
- Click the pencil icon next to Steps
- Add “session_start” as Step 1
- Add “view_item” as Step 2
- Add “add_to_cart” as Step 3
- Add “begin_checkout” as Step 4
- Add “purchase” as Step 5
- Click the blue Apply button
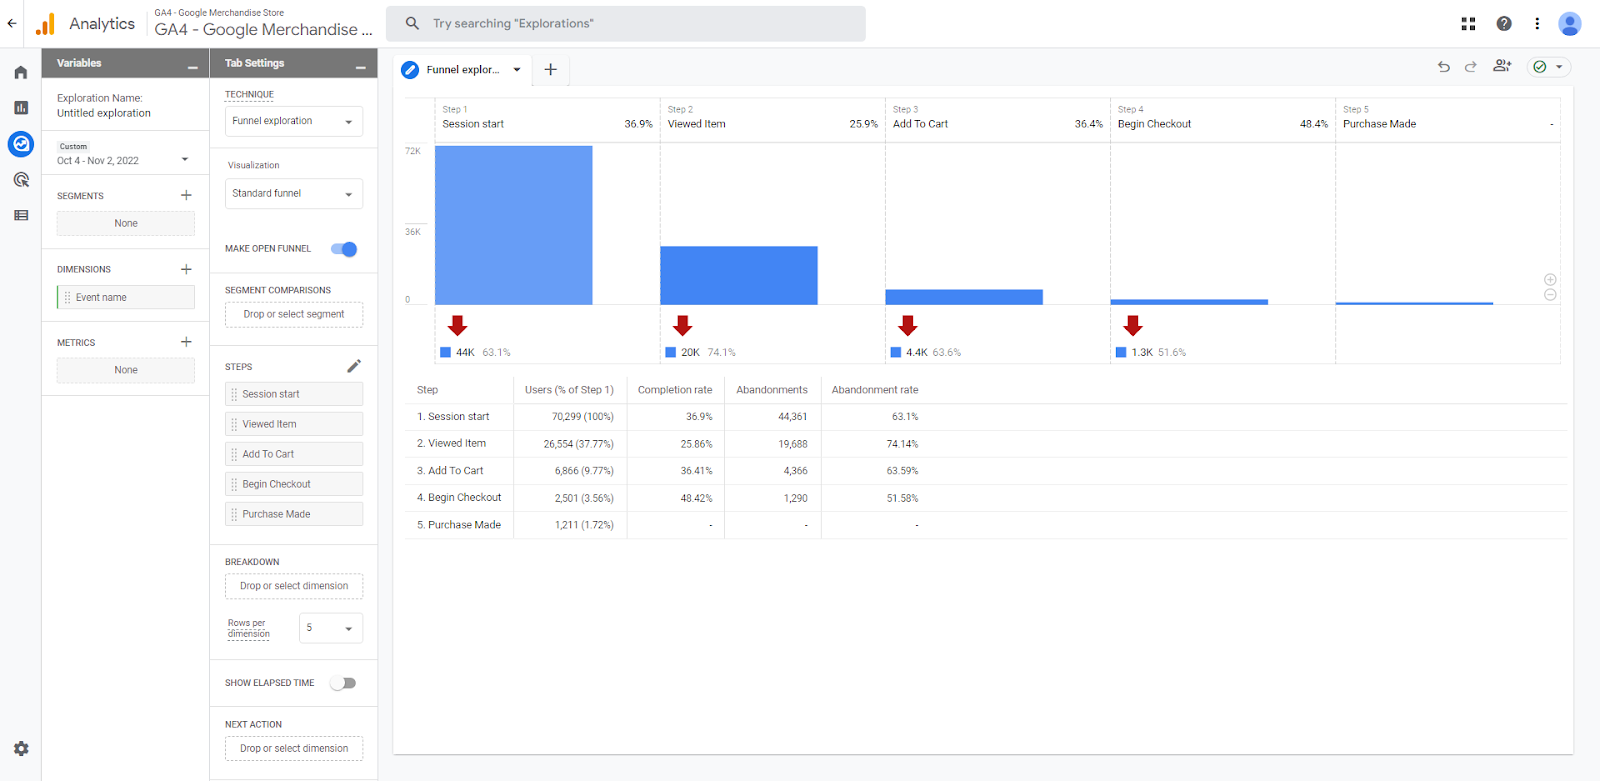
Pro Tip: You can actually combine the Shopping Behavior and Checkout Behavior reports from Universal Analytics into one super report in GA4 that gives you a full view into every step of the shopping and checkout process. To do so, simply add any additional checkout events, such as begin_checkout, add_shipping_info, and add_payment_info, as steps into your Funnel Exploration from above.
GA4 Explore reports are designed to give you maxium flexibility with your data. If you don’t see a specific report that you’re looking for, you can always create one using Explorations in GA4.
Product Performance Report
Universal Analytics Location: Conversions > Ecommerce > Product Performance
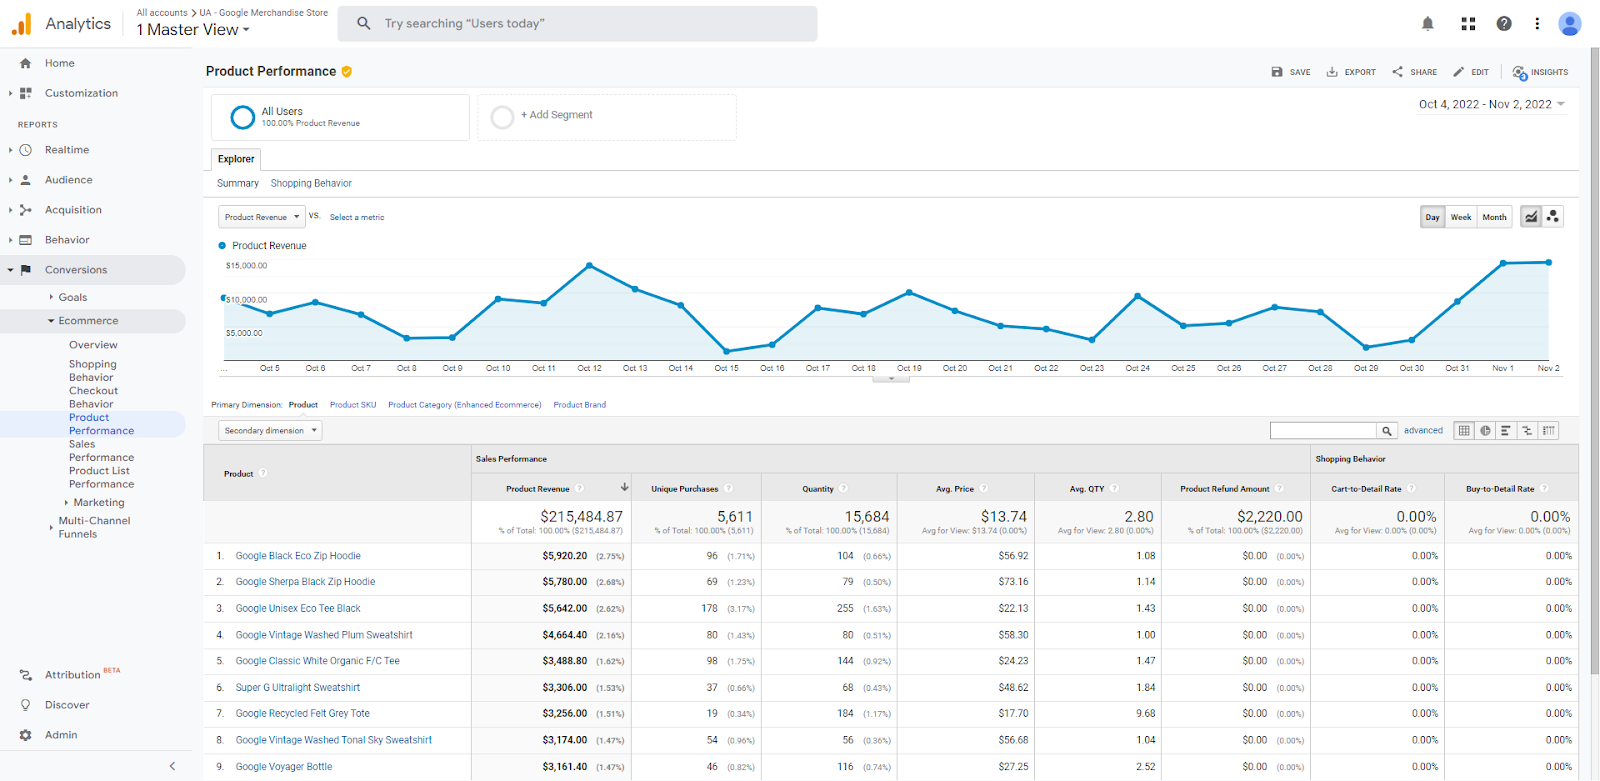
Google Analytics 4 Location: Reports > Life cycle > Monetization > Ecommerce purchases
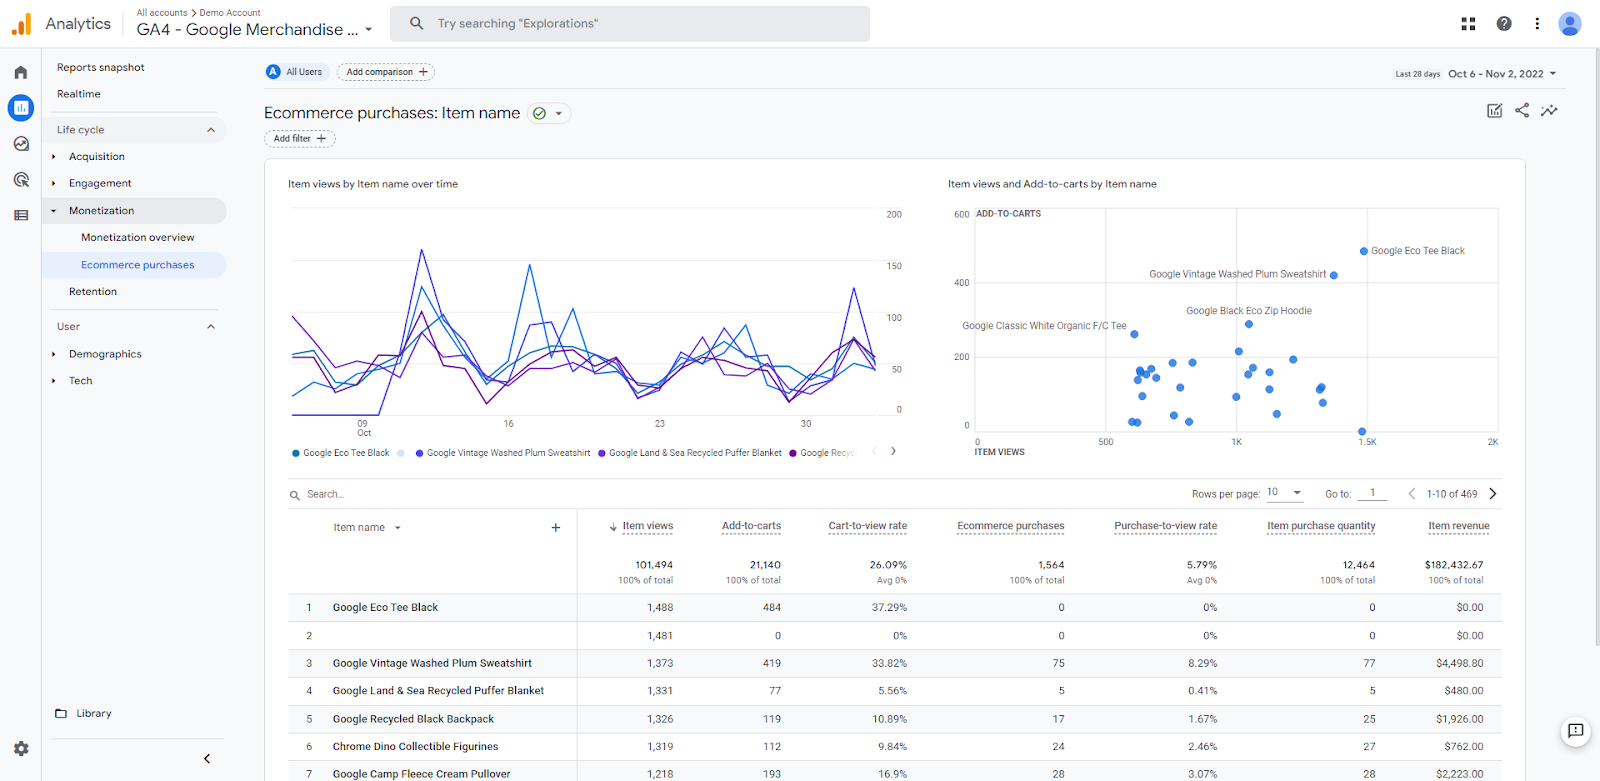
While Item name is the default view for the Ecommerce purchases report in GA4, here is a list of all the standard ways you can use this report breakdown your ecommerce data in GA4:
- Item Name (Google Eco Tee Black, Google Vintage Washed Plug Sweatshirt, Etc) – This report
- Item ID (GGOEGXXX2038, GGOEGXXX1189, GGOEGBRB186599, etc)
- Item category (Sale, Men’s / Unisex, Women’s, etc)
- Item category 2 (Apparel, Accessories, Shoes, etc)
- Item category 3 (T-shirts, Sweatshirts, Dresses, etc)
- Item category 4 (Short Sleeve, Long Sleeve, Sundress, etc)
- Item category 5 (Adult, Kids, Infant, etc)
- Item brand (Google, Alphabet, etc)
Pro Tip: The information displayed in this report comes from information collected in the items array. If data isn’t displaying correctly, we’d recommend QA’ing what information is passed into your items parameter using the Configure > DebugView in GA4 like in the screenshot below.

Top Conversion Paths / Assisted Conversions
Universal Analytics Location: Conversions > Multi-Channel Funnels > Top Conversion Paths
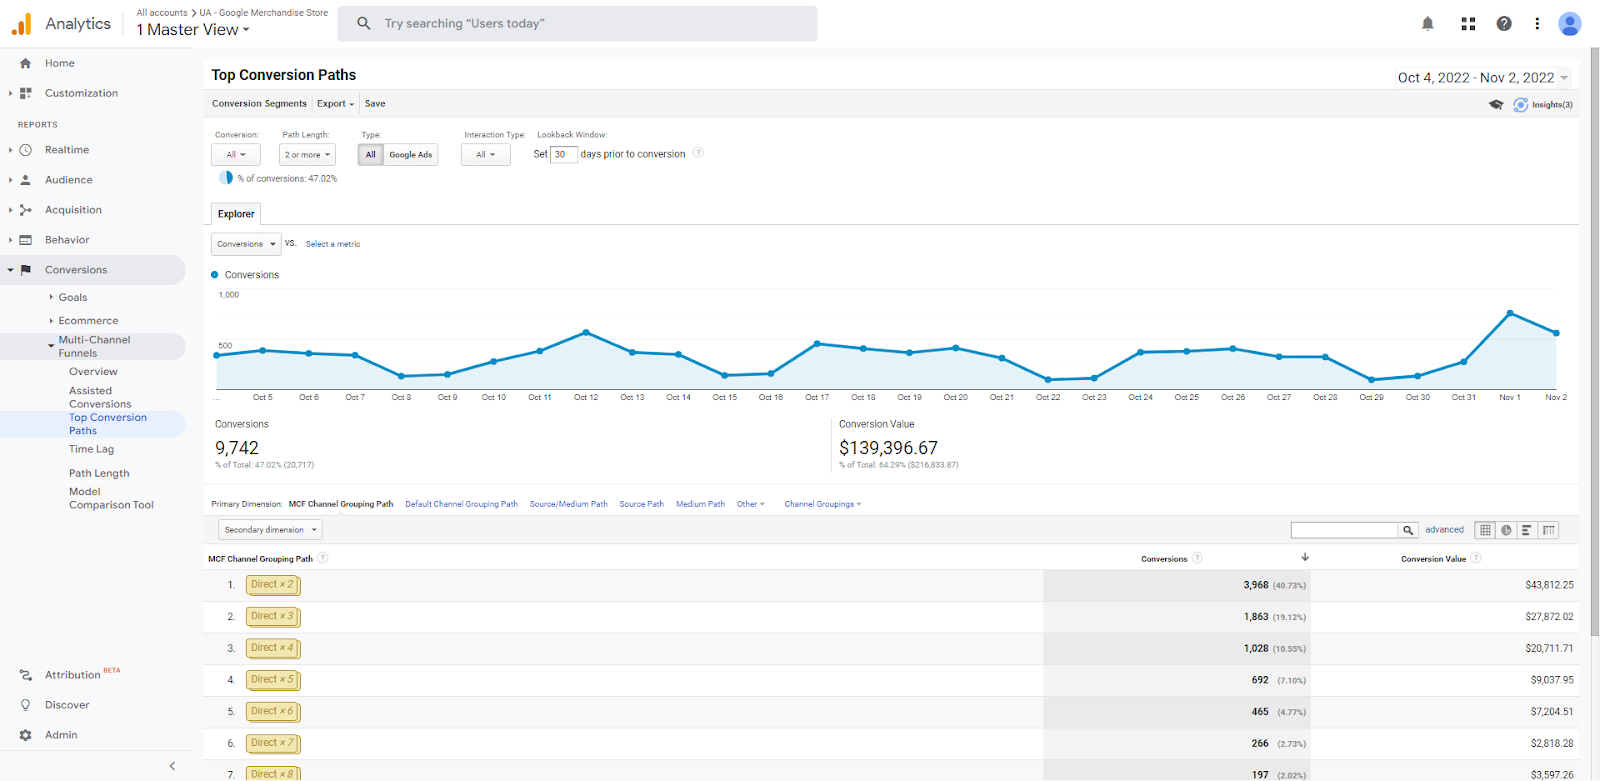
Google Analytics 4 Location: Advertising > Attribution > Conversion paths
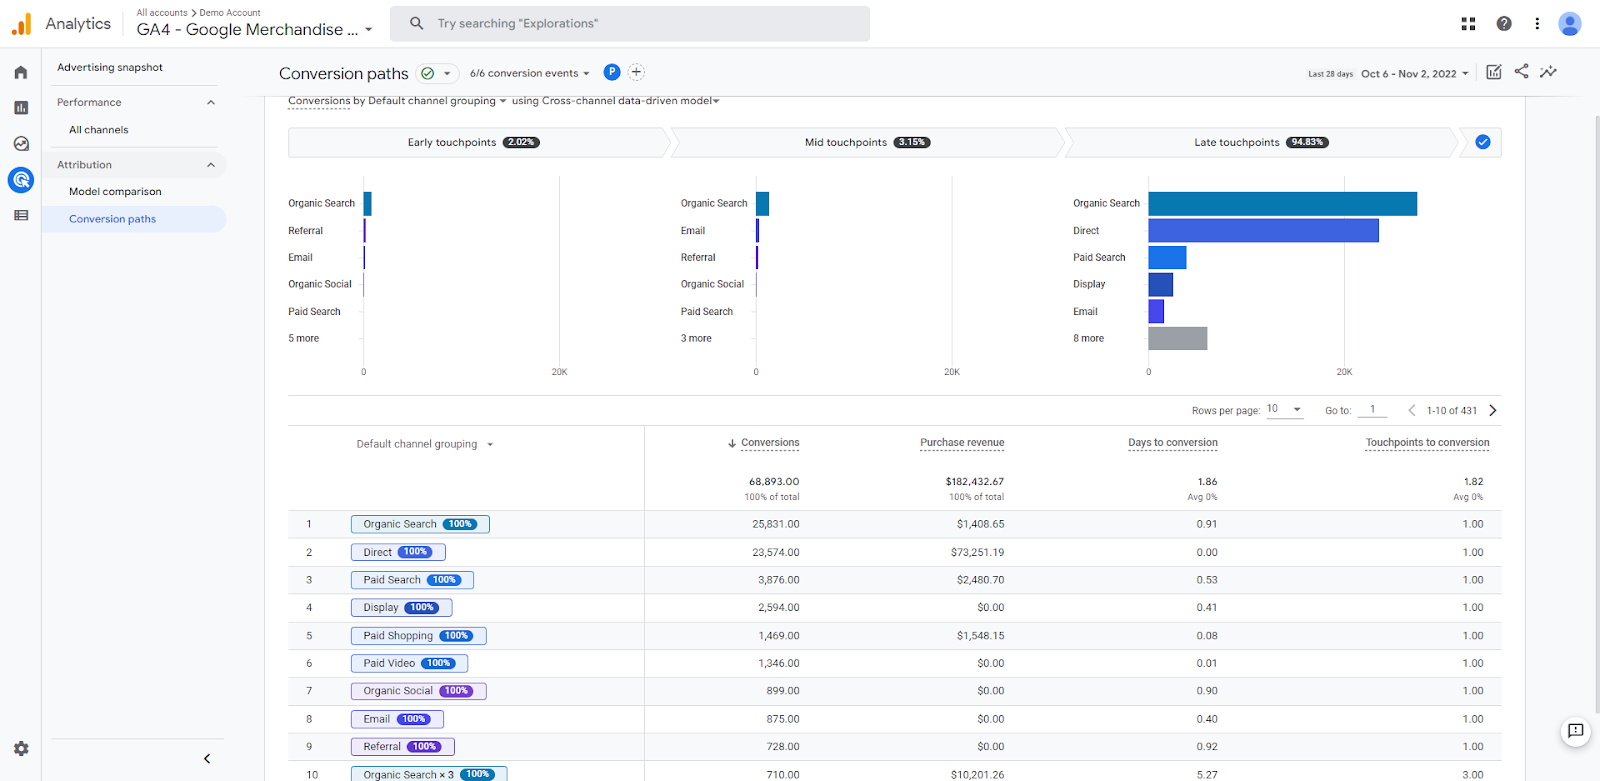
On this same report, it is also possible to see your conversion data broken down by the following:
- Default channel grouping (Organic Search, Paid Search, Paid Video, etc) – This report
- Source (google, baidu, direct, etc)
- Medium (organic, referral, email, etc)
- Campaign (organic, not set, Google Analytics Demo, etc)
Pro Tip: If you are looking for Assisted Conversions in GA4, they don’t exist in the same way. And we think this is a good thing. While Assisted Conversions tried to help marketers value upstream touchpoints (read: non-last click touch points), the Assisted Conversions data model was quite confusing because it gave every touch point that wasn’t attributed to the conversion an “assist.” In simple terms, this meant that if a user had 5 touchpoints, then the last non-direct touchpoint would get the conversion and the other 4 touchpoints would get an assist. That’s 4 assists evenly distributed (linear). In Google Analytics 4, you can more easily compare the effects of different multitouch attribution models including GA4’s data-driven attribution model on the Model Comparison report.
Wrapping Up
As of this posting, Google Analytics 4 is still very much a work in progress, but it’s already an extremely powerful tool with many benefits to using it instead of Universal Analytics. With a little more refinement, it’ll surely be better than Universal Analytics ever was. We have one more Pro Tip for you too!
Pro Tip: Unlike with Universal Analytics, nearly all the standard GA4 reports can be customized further to your specifications by clicking the pencil icon in the top right. This lets you add/remove metrics, reorder the default dimensions, hide or change the charts, and even create new summary cards. Take advantage of these customization features to make GA4 your own.
If for some reason you still like the Universal Analytics interface better, you can check out “GA4 Classic Mode” which is actually just a Looker Studio report that’s built to make your GA4 data look like Universal Analytics.
All that said, Google Analytics 4 marks a drastic paradigm shift that marketers and business owners will need to get used to. The more time you spend using it, the more comfortable you’ll be answering those important business questions.
We hope this article helped you become more familiar with how to find the same information in GA4 that you’re used to in Universal Analytics. If you have questions about where to find specific reports in GA4, let us know in the comments below, or for more personalized GA assistance and full setup, take a look at our Google Analytics setup service.
2 Responses
This was great, thank you for this. However, you may want to update it.. the wonderful people at Google must have made changes as at least one wasn’t available any longer… Google Ads Campaign Report – no longer able to add secondary campaign… or at least I can’t. I can see where it can be done in other places, just not here.
You are correct. We are seeing the same thing.
For now, since we can’t tell if this is a bug or intentionally taken away, you have at least 3 alternative options:
If you use #1 above, you could also add the platform name (Google Ads) to your campaign name nomenclature to make filtering easier.